Flood insurance averaging $947 annually nationwide
Flood coverage now averages roughly $947 a year nationwide, which means you are weighing a four-figure line item against the risk of a single storm wiping out your home’s equity. You face that choice in a market where flood risk is rising, standard homeowners policies exclude this damage, and the rules that govern pricing are shifting under your feet.
By understanding how that $947 figure relates to your own property, you can decide whether to buy a policy, how much coverage to carry, and where to look for savings. You also gain leverage when you compare quotes, appeal a new rate, or push your community to adopt measures that reduce everyone’s premiums.
How the $947 national average stacks up
You often hear one national number and assume it applies to you, but flood insurance pricing is fragmented enough that any single average hides a wide range of outcomes. One detailed review of flood policies pegs the typical cost at about $75 per month, or roughly $900 a year, for coverage across the country, which lands close to that $947 benchmark and gives you a sense of the ballpark for a standard home in a moderate-risk area. Another independent analysis of policyholder data finds that the typical bill is $74 a month, or exactly $888 per year, which again clusters around the same range and reinforces that the four-figure annual cost is not an outlier but a center of gravity for many households.
At the same time, other research that relies on Federal Emergency Management Agency data calculates a national average of $926 per year, and a separate review of National Flood Insurance Program policies reports that those government-backed contracts cost just over $1,100 per year on average. When you line these findings up, you see a band that runs from $888 per year through $926 per year and then to $1,100 per year, with the commonly cited $947 figure sitting in the middle. The spread reflects different datasets and methods, but for you as a homeowner it signals something more practical: if your quote is far above that range for a typical single-family home, you are probably in a higher-risk zone or carrying unusually broad coverage, and you should understand why.
Why your own premium can be far from average
Even if the national mean sits near $947, the price you actually pay is driven by a long list of property-specific details that can push you well below or above that level. The size of your house, the number of stories, the presence of a basement, and the elevation of your lowest floor relative to the local floodplain all feed into the models that set your rate. Where your home sits on the map matters just as much as how it is built, so a cottage perched on high ground in a coastal county can sometimes be cheaper to insure than a split-level house next to a creek in a landlocked state, even when both owners carry similar coverage limits.
Modern pricing systems factor in your distance to water, the type of flooding that threatens your address, and the cost to rebuild your structure, not just the broad zone letter on an old map. Under the current approach used to price single-family homes, rates are meant to better match a property’s flood risk through advanced tools that draw on industry best practices, which means two neighbors on the same street can see very different bills if one sits lower or has a larger replacement cost. This variation also shows up in the distribution of policies by price: in one official breakdown of single-family home contracts, 37% of the policies fall into a specific price band, which shows how many households cluster at modest premiums while others pay significantly more.
How NFIP coverage works and where private insurers fit
Most residential flood insurance in the United States still runs through the National Flood Insurance Program, which sets standard coverage rules and works with private agents to issue policies. Under the NFIP, you can buy up to $250,000 of building coverage for your structure, and you can also add a separate limit for your contents, which is crucial if you keep costly items in a basement or ground floor that might take on water. That cap means you might need supplemental protection if you own a higher-value home, but for many middle-income households the NFIP limit matches or comes close to the cost to rebuild.
Private flood insurers have started to compete with NFIP policies in some markets, and in certain cases they can offer lower premiums or higher limits because they use different capital and reinsurance structures. One actuarial review of the sector asks directly whether private flood insurance could be cheaper than the NFIP and finds that in some scenarios, especially for lower-risk properties, private carriers can undercut the standard program. Median cost figures also highlight how NFIP pricing behaves across states, such as a table of NFIP median flood insurance costs by state that includes a median flood insurance cost of $1,174 in at least one jurisdiction, which is already above the $947 national average and illustrates how location can quickly drive you into a more expensive tier.
What Risk Rating 2.0 changed for your bill
If you have carried a flood policy for several years, you have probably heard about Risk Rating 2.0 and may have already seen it in your renewal notice. The idea behind this overhaul is to move away from blunt zone-based pricing and toward a more property-specific model that reflects distance to water, types of flooding, and replacement cost. Official descriptions of the new system emphasize that it uses industry best practices and advanced tools so that rates better match a property’s flood risk, which in theory should make pricing fairer for you if you own a relatively safe home in a historically expensive zone.
In practice, the transition has been bumpy. Some policyholders report that when the 2.0 rates took effect, everyone saw a full-risk premium calculated, and since 2.0 rates were higher than the legacy ones, NFIP is gradually moving existing customers toward those higher levels with annual increases. A separate discussion of commercial flood pricing under Risk Rating 2.0 notes that you can view state-by-state breakdowns of estimated premium changes, which shows that in some regions owners of residential buildings face steep jumps while others see modest cuts. For you, the key takeaway is that any sudden spike in your premium is likely tied to this shift, and understanding how your property’s risk profile looks under the new model can help you challenge errors or adjust your coverage.
How NFIP and private insurers calculate risk
Behind every flood quote you receive sits a risk model that tries to predict how much water might reach your home and how much it would cost to repair. Federal agencies map flood hazards using tools such as the official map service center, which lets you search for your address and see the designated flood zone that still feeds into many underwriting decisions. Those maps, combined with local elevation data and historical claims, form the backbone of NFIP pricing and inform community-level decisions about where to allow construction and how to design drainage systems.
Insurers then layer on their own data. The NFIP’s single-family home pricing methodology explains that rates incorporate factors such as distance to coastlines or rivers, type of flooding, and building characteristics so that premiums better reflect actual risk. Private carriers use similar inputs but may rely more heavily on proprietary models and reinsurance costs, which is why one analysis of private flood insurance concludes that in certain markets private coverage can be cheaper than the NFIP while in others it is more expensive. When you compare quotes, you are effectively comparing how different models view the same property, and small differences in how they treat elevation or storm surge can translate into hundreds of dollars around that $947 benchmark.
Why homeowners insurance is not enough
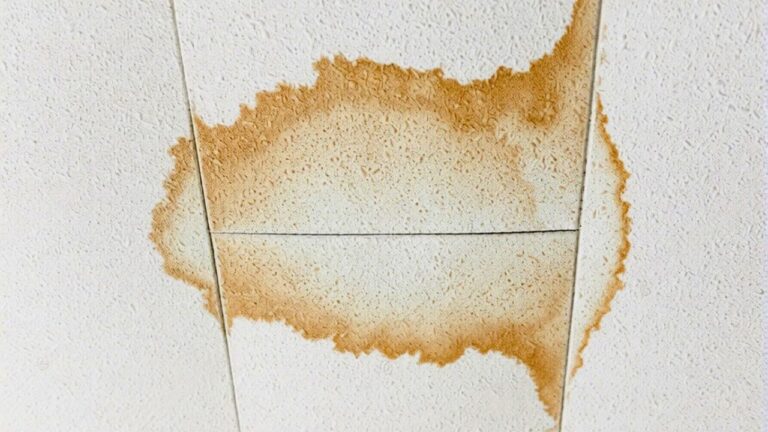
You might assume that your standard homeowners policy covers any damage from water that enters your house, but the fine print usually draws a sharp line between a burst pipe and a rising river. Industry statistics make clear that flood damage is excluded under standard homeowners and renters insurance policies, which means you cannot rely on your regular insurer to pay for repairs if a creek overflows, a storm surge pushes into your neighborhood, or heavy rain overwhelms local drains and backs up into your basement. Instead, you need a separate flood policy, either through the NFIP or a private carrier, if you want protection against those events.
The stakes are high. Just 1 inch of flood water can cause $25,000 in damages, according to one widely cited analysis of claims data, and that figure only covers direct physical repairs, not the cost of temporary housing or lost income. When you compare that $25,000 potential loss to an annual premium near $947, the value proposition becomes clearer, especially if you live in a place where flooding has happened before or where new development is changing drainage patterns. You also have to remember that some lenders require flood insurance as a condition of your mortgage if your property sits in a high-risk zone, so skipping coverage might not be an option at all.
How your location and community choices affect price
Your address does more than determine your base risk score; it also shapes which discounts and surcharges apply. The Community Rating System run by federal officials rewards towns and counties that adopt stronger floodplain management, better building codes, and public education with premium reductions for residents. If your community participates in this program, you can see a percentage cut in your NFIP premium, which directly lowers your cost relative to the $947 national figure without any change to your individual risk.
Location also drives the median cost patterns that show up in state-level data. One insurer’s breakdown of NFIP median flood insurance costs by state lists a median flood insurance cost of $1,174 in at least one state, which signals that in certain regions, especially along vulnerable coasts or in river basins, the typical homeowner already pays hundreds of dollars more than the national average. Another provider’s table of NFIP median flood insurance costs by state highlights similar disparities, with some inland states showing median costs closer to a few hundred dollars and others clustering above $1,000. When you factor in local building codes, drainage infrastructure, and development patterns, you start to see how much your neighbors’ choices and your local government’s planning can influence your own bill.
Practical ways to lower your premium
Even if you live in a high-risk area, you are not powerless when you look at your renewal notice. Federal guidance for policyholders lays out several steps you can take to pay less, such as elevating utilities, installing flood vents, or filling in a basement that sits below the base flood elevation. An official page that explains how you can pay less for flood coverage emphasizes that mitigation measures which reduce the expected depth of water in your home can translate into lower premiums, because the pricing models see a smaller potential loss.
You can also shop around more than you might think. Some private carriers advertise that flood insurance rates are calculated based on a property’s specific risk-based cost of insurance, which means they might view your elevation or distance to water more favorably than the NFIP model does. Independent reviews of flood insurance pricing point out that in some cases, especially for lower-risk homes, private policies can come in under NFIP rates, while for higher-risk properties the government-backed option may still be a better choice. If you combine structural mitigation, community-level discounts through the Community Rating System, and a careful comparison of NFIP and private quotes, you can often pull your annual cost closer to or even below that $947 benchmark.
How flood insurance fits into your household budget
How to get started if you are uninsured or rethinking coverage
Like Fix It Homestead’s content? Be sure to follow us.
Here’s more from us:
- I made Joanna Gaines’s Friendsgiving casserole and here is what I would keep
- Pump Shotguns That Jam the Moment You Actually Need Them
- The First 5 Things Guests Notice About Your Living Room at Christmas
- What Caliber Works Best for Groundhogs, Armadillos, and Other Digging Pests?
- Rifles worth keeping by the back door on any rural property
*This article was developed with AI-powered tools and has been carefully reviewed by our editors.